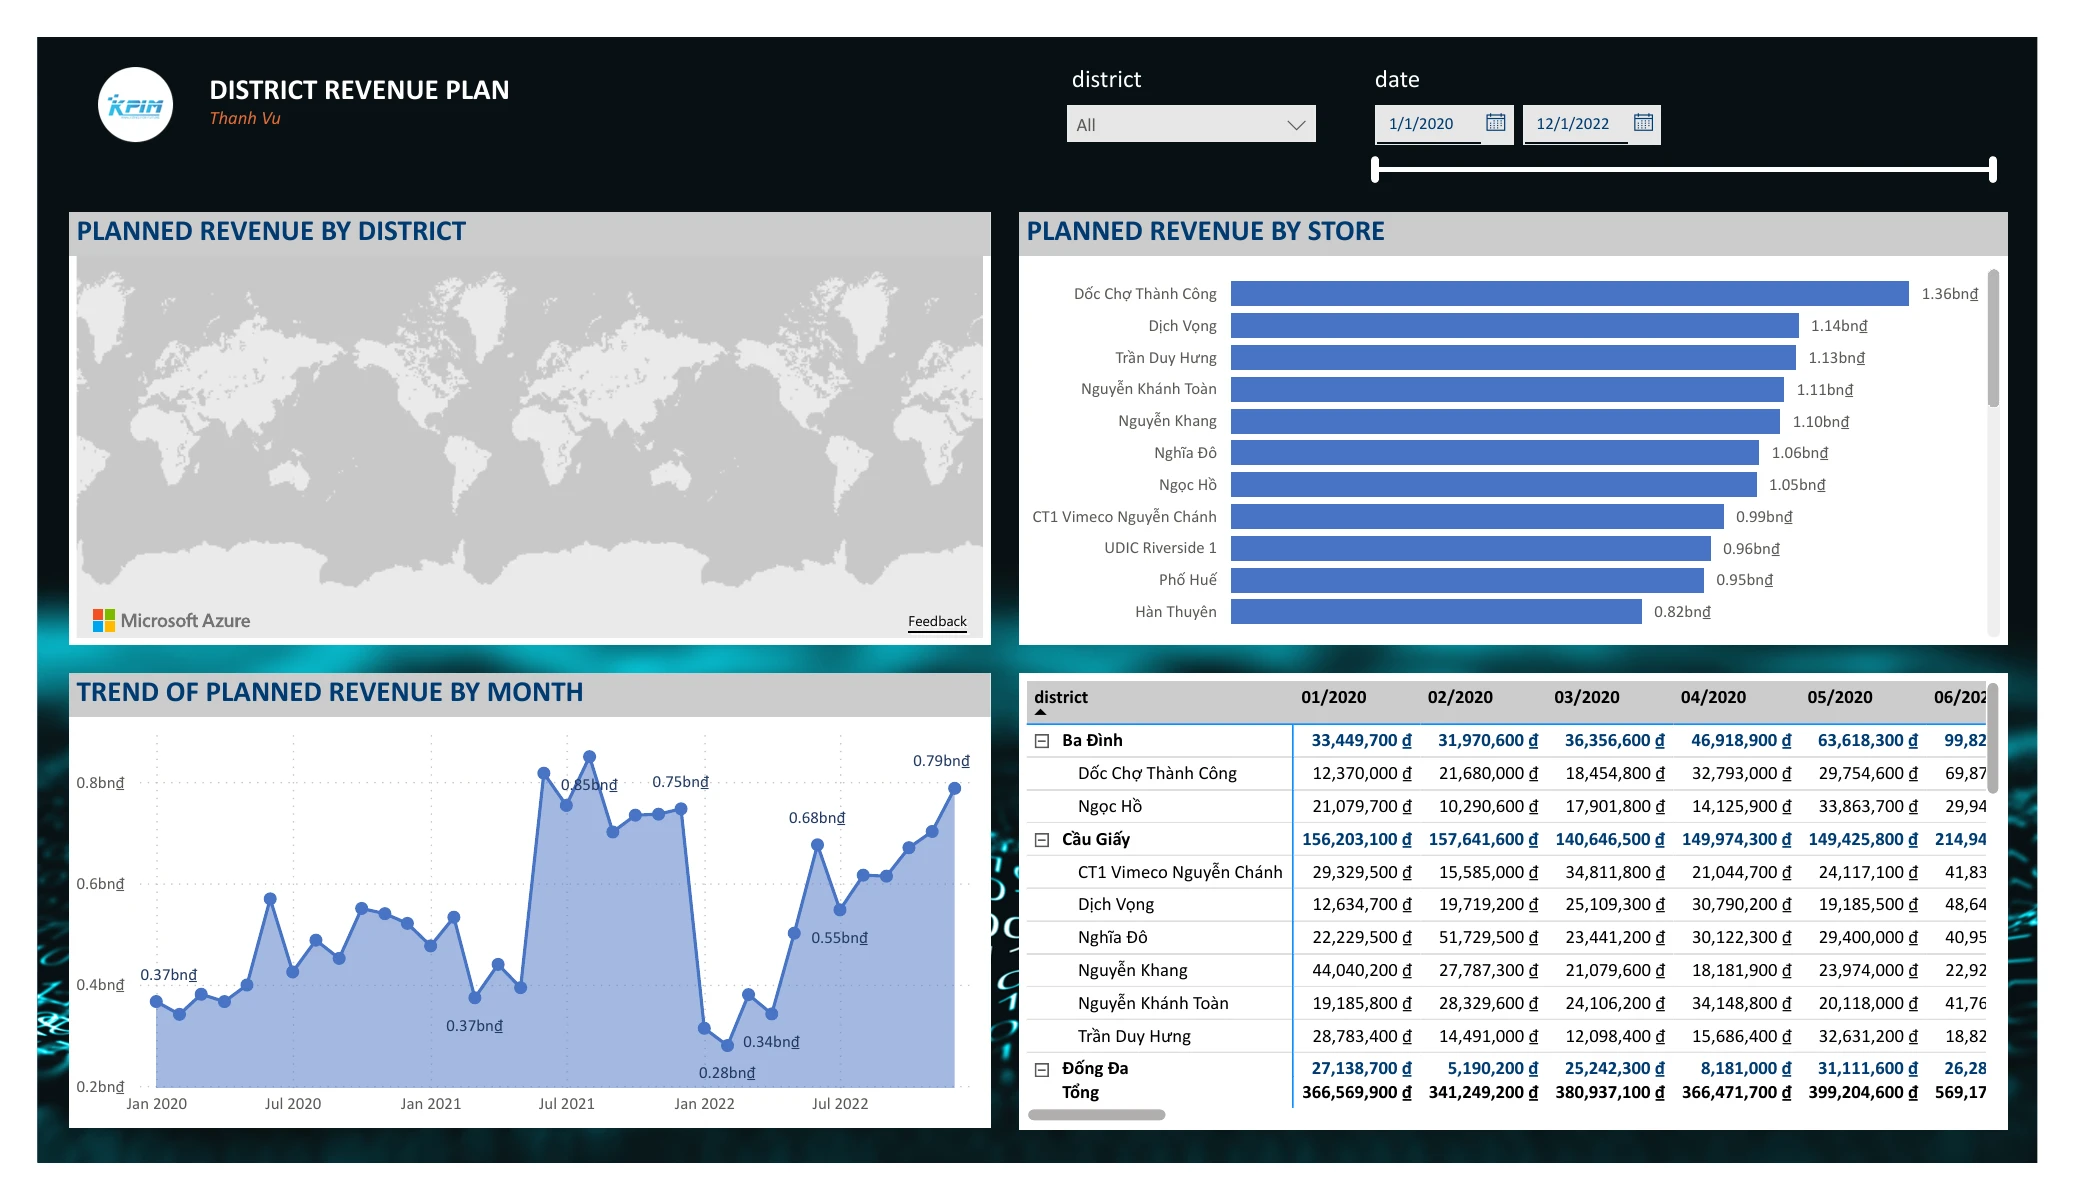
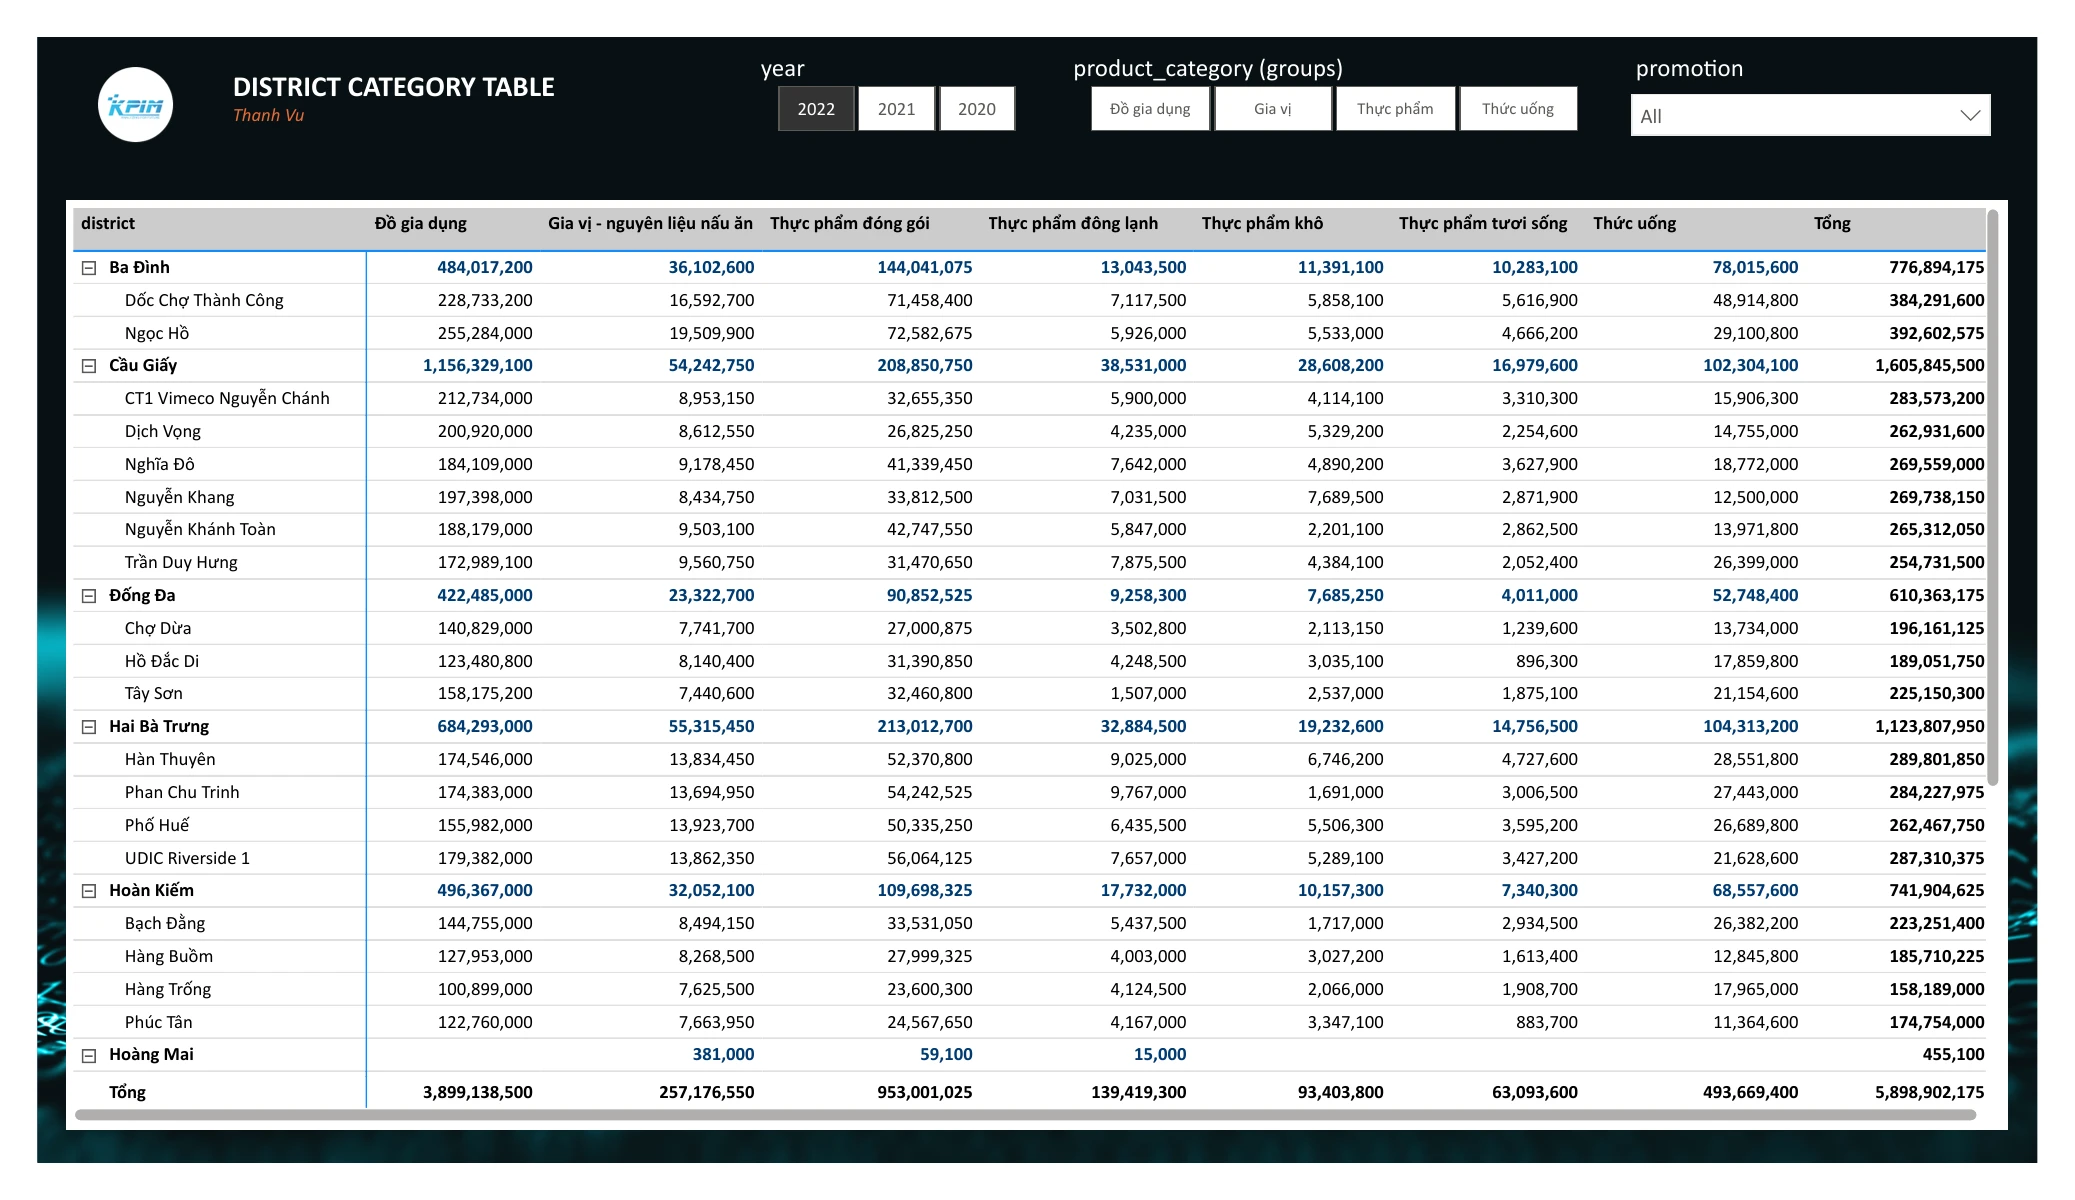
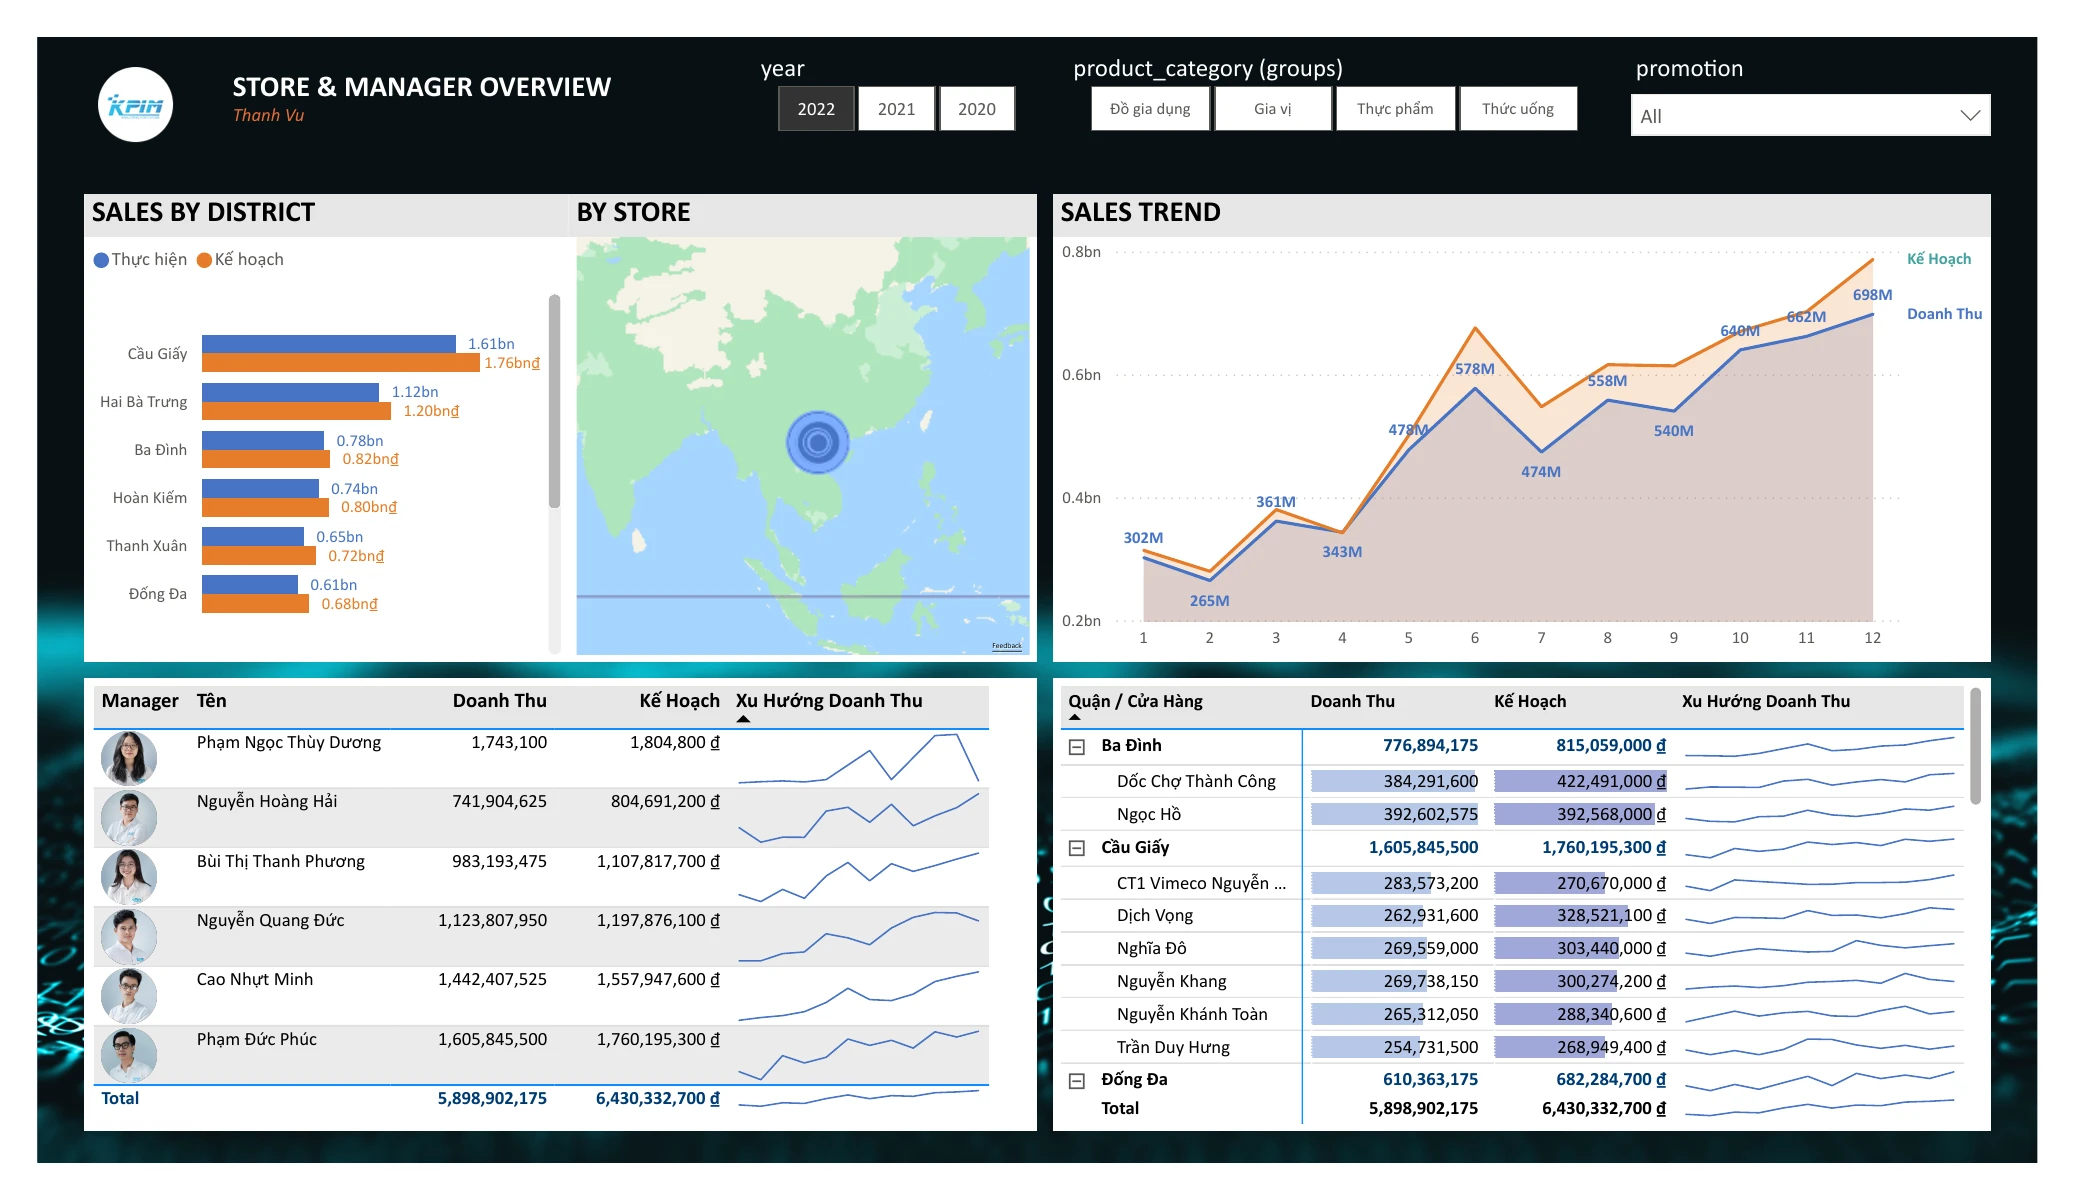
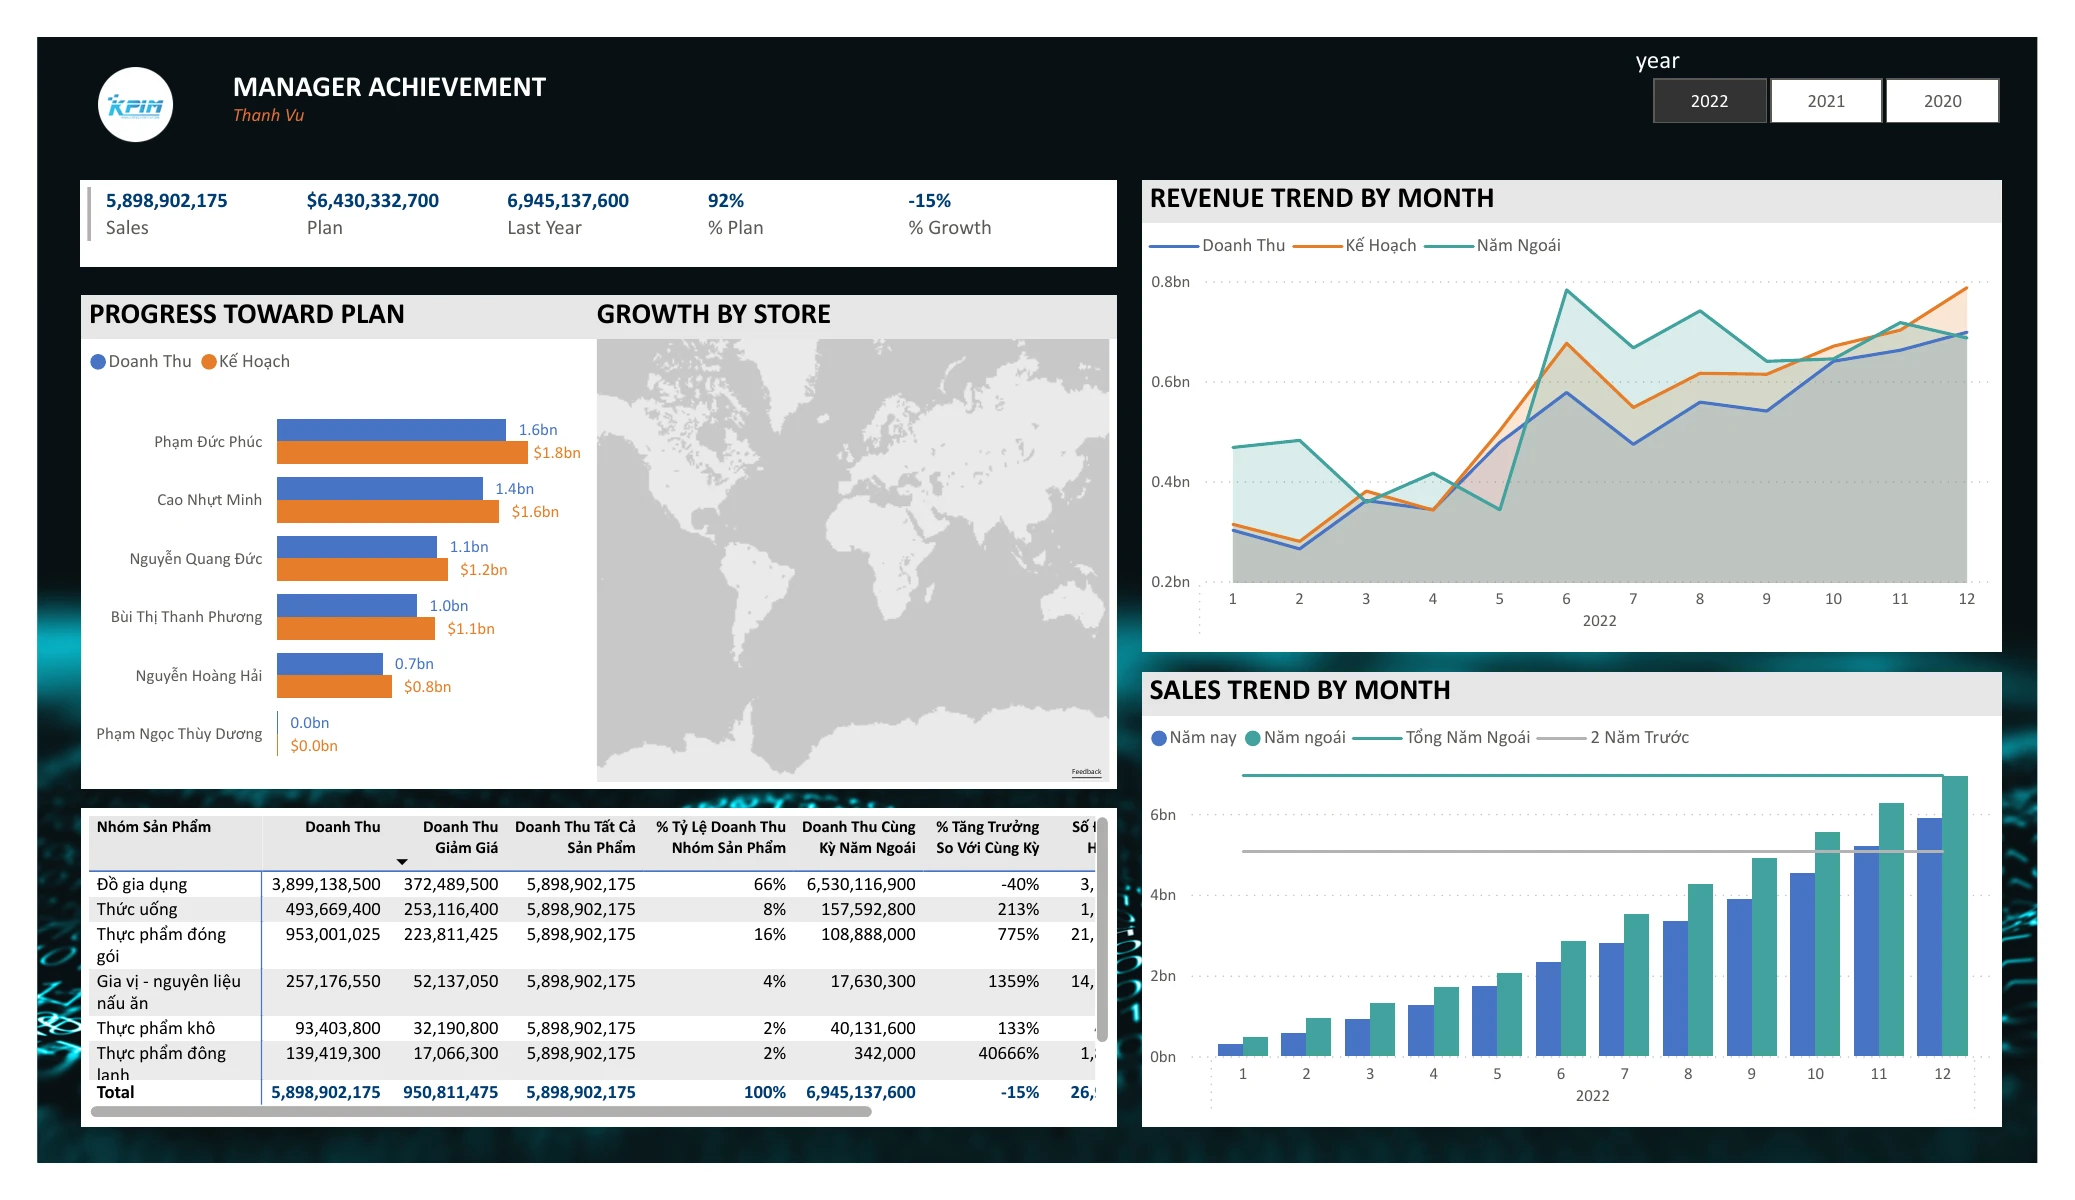
Which stores, regions, and product groups are meeting their monthly plan, and which are falling behind? And how is performance trending year over year and over the last 12 months?
Retail managers need to know early which stores, regions, and product groups are going to miss their monthly targets, so they can act before the month closes rather than explain the miss afterwards.
A multi-page Power BI solution on a synthetic dataset for the KPIM Mart retail chain that gives managers full visibility into sales performance, plan attainment, and growth trends.
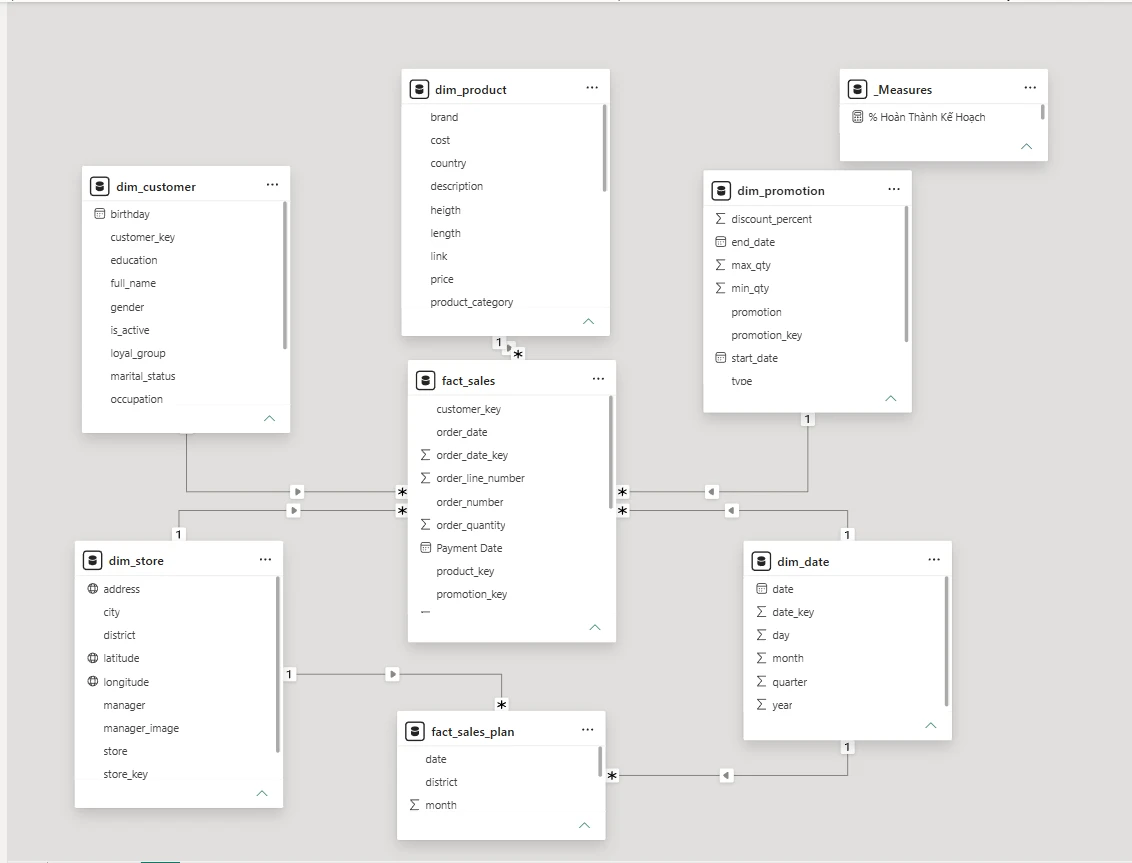
Sales and monthly plan data from SQL Server are modeled as a galaxy schema: two fact tables, actual sales and plan targets, sharing conformed dimensions, so the two can be compared at any grain.
DAX measures calculate plan completion, year-over-year growth, year-to-date comparisons, and rolling 12-month trends by store, product group, and region, and drill-through takes a manager from a summary number to the transactions behind it.