What I built
- 01BLS + BEA data
- BLS and BEA public data
- 02Excel workbook
- 03Power Query
- Power Query
- 04Multi-fact model
- Multi-fact modeling
- 05Power BI reportUnemployment, pay and employers by sector
- Power BI
Project 04 // Analytics · 2026
Benchmarking a county economy against the state and the nation
The question
How is Lancaster County's economy performing relative to the state and the nation, and which industries drive its output and wages?
What I built
What it found
Full case study // tap a section to open it
How is Lancaster County's economy performing relative to the state and the nation, and which industries drive its output and wages?
Economic development staff brief investors, officials, and partners on how the county is doing. They need a trusted, side-by-side view of Lancaster against Pennsylvania and the U.S. on jobs, output, and pay, built from official public data.
Built as a technical interview case study for the Center for Regional Analysis at EDC Lancaster County, before I joined the team as a Data Analyst Fellow.
An interactive Power BI report that benchmarks Lancaster County, Pennsylvania against the state and the nation on the labor market, real GDP by industry, and wages, using public data from the Bureau of Labor Statistics and the Bureau of Economic Analysis.
I built it as a technical interview case study for the Center for Regional Analysis at EDC Lancaster County, before joining the team as a Data Analyst Fellow.
Side-by-side comparisons let economic development staff see quickly where Lancaster outperforms or lags, in a format ready for presentations to investors, officials, and partners.
Solo project, built as a technical interview case study: data preparation, the multi-fact model, benchmarking measures, and a two-page report.
Pulled BLS Local Area Unemployment Statistics (2015–2025, monthly), BEA real GDP by county and industry (chained 2017 dollars), and BLS QCEW wages.
Modeled a star-schema variant with several fact tables sharing dimensions, so labor, GDP, and wage data filter together.
Built a measures table for benchmarking: industry share of total, Lancaster ÷ PA, and Lancaster ÷ U.S.
Designed a two-page report: a labor market page that toggles between Lancaster, Pennsylvania, and rate views, and an economic growth page for GDP, wages, and employment.
Two report pages (60 visuals) with toggles between Lancaster, Pennsylvania, and percentage-rate views, a custom Power KPI visual, and a navy theme.
Shaping seven Excel sheets: unpivoting, date parsing, type casting, and combining them into model tables.
Benchmarking measures: industry share of total, average annual rate, Lancaster ÷ PA, and Lancaster ÷ U.S.
Monthly labor force, employment, and unemployment (2015–2025), plus private-sector wages by NAICS sector.
Real GDP by county and industry in chained 2017 dollars, 2001–2024, for Lancaster, PA, and the U.S.
Source workbook holding all seven datasets.
A star-schema variant with several fact tables sharing dimensions, so labor, GDP, and wage data can be filtered together by place, industry, and date.
Fact table
Monthly labor force, employment, unemployment, and unemployment rate by geography.
Fact table
Real GDP by industry line code and geography, in thousands of chained 2017 dollars.
Fact table
2024 Lancaster average employment and annual wages per employee by NAICS sector.
Fact table
Lancaster average annual private-sector pay, 2014–2024.
Dimension
Lancaster, Pennsylvania, and United States, keyed by FIPS.
Dimension
NAICS codes mapped to sector names for GDP and wage analysis.
Dimension
Date, month, and year for monthly and annual views.
Measures
Share-of-total and Lancaster-versus-benchmark ratios.
Try it // runs in your browser
Annual unemployment rates (percent) for Lancaster County and Pennsylvania from the public series shown in the dashboard. Edit the code and run it.
Table unemployment: year, lancaster, pennsylvania
Results appear here (first 10 rows). In Python, the last expression is shown, and print() works too.
Rebuilt from the project's data so it opens in any browser, no login. Use the filters and every visual recalculates.
Geography
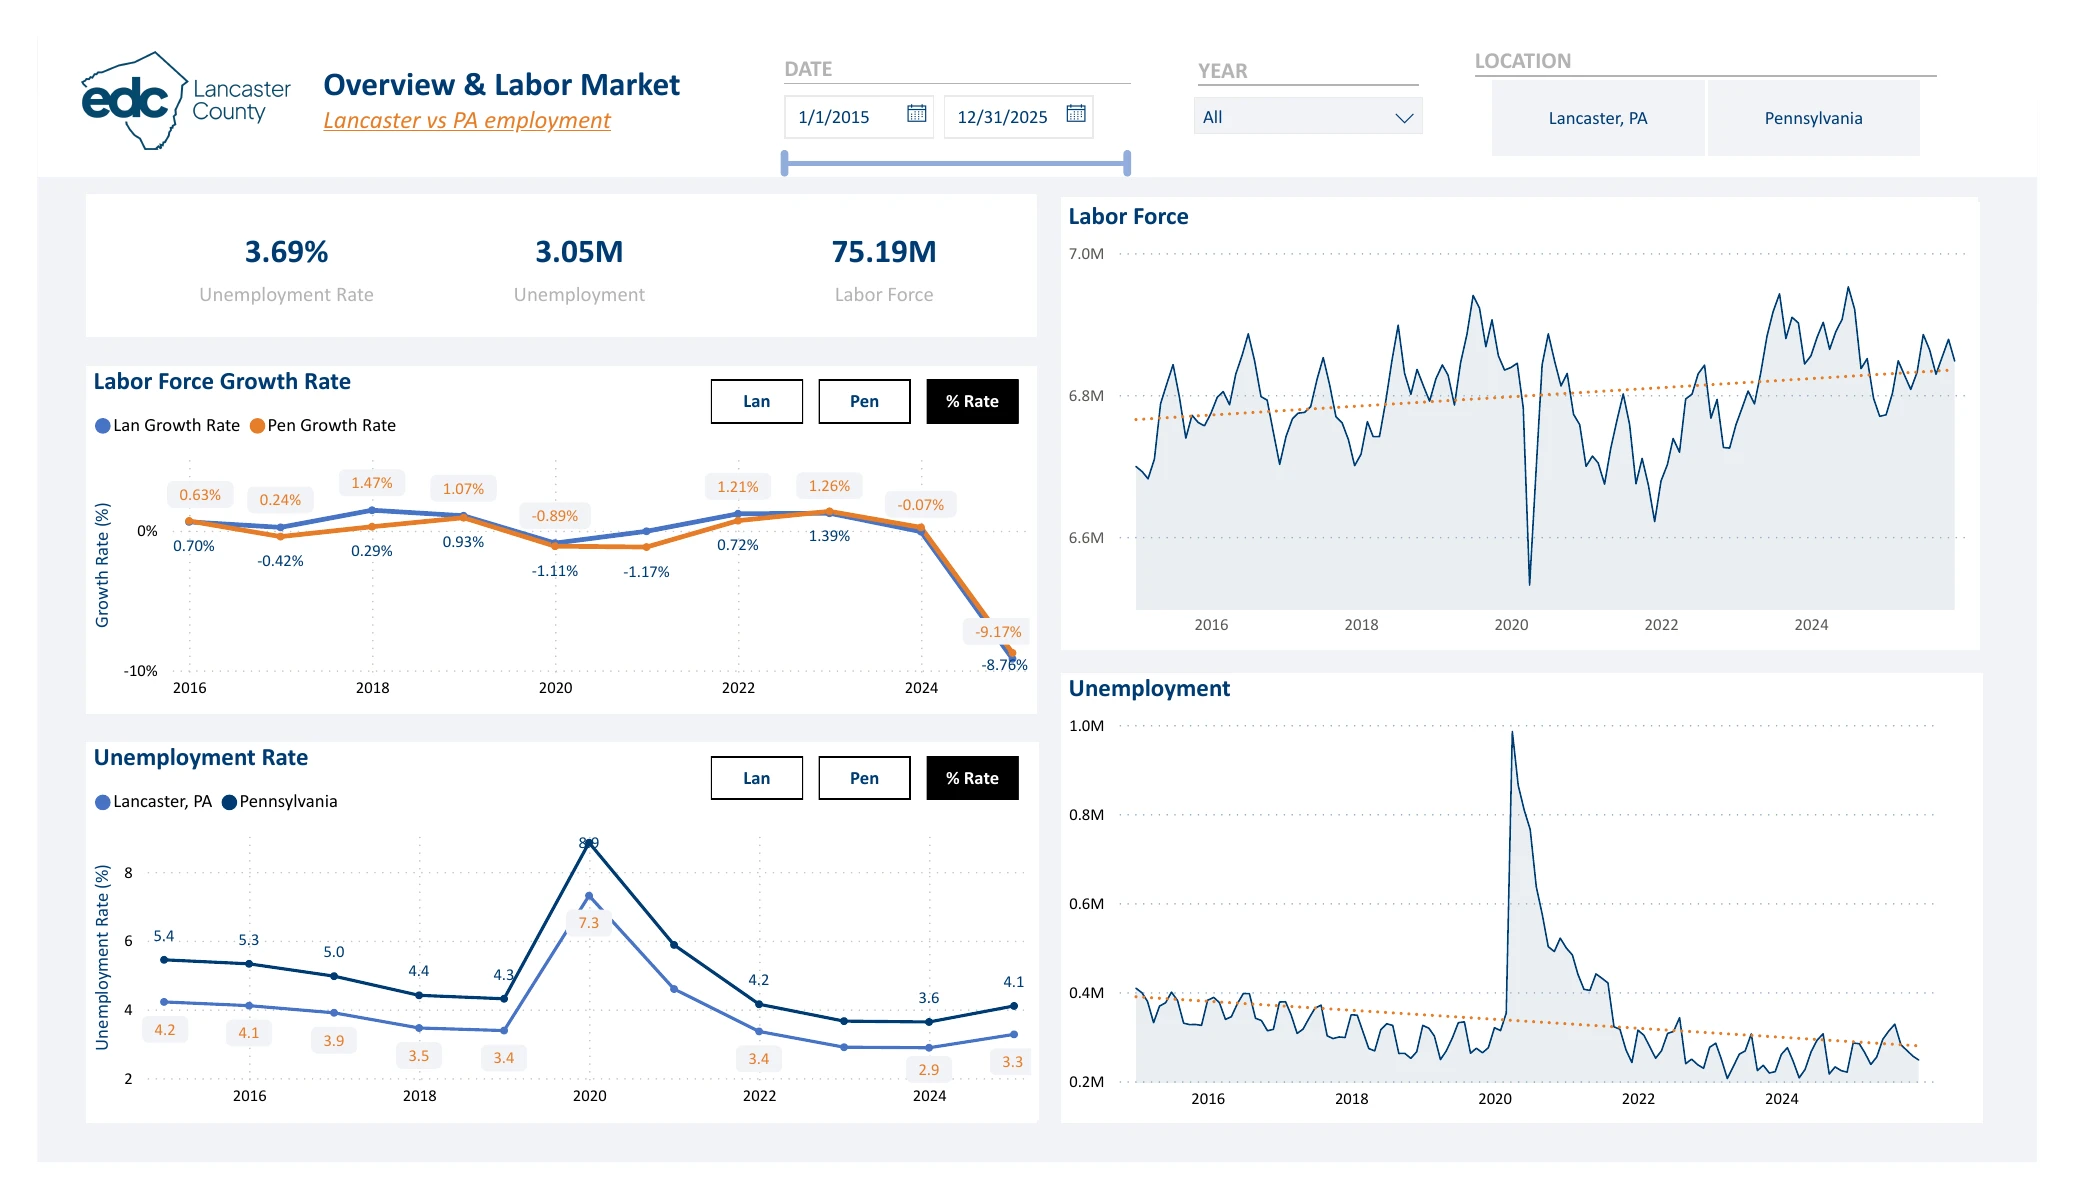
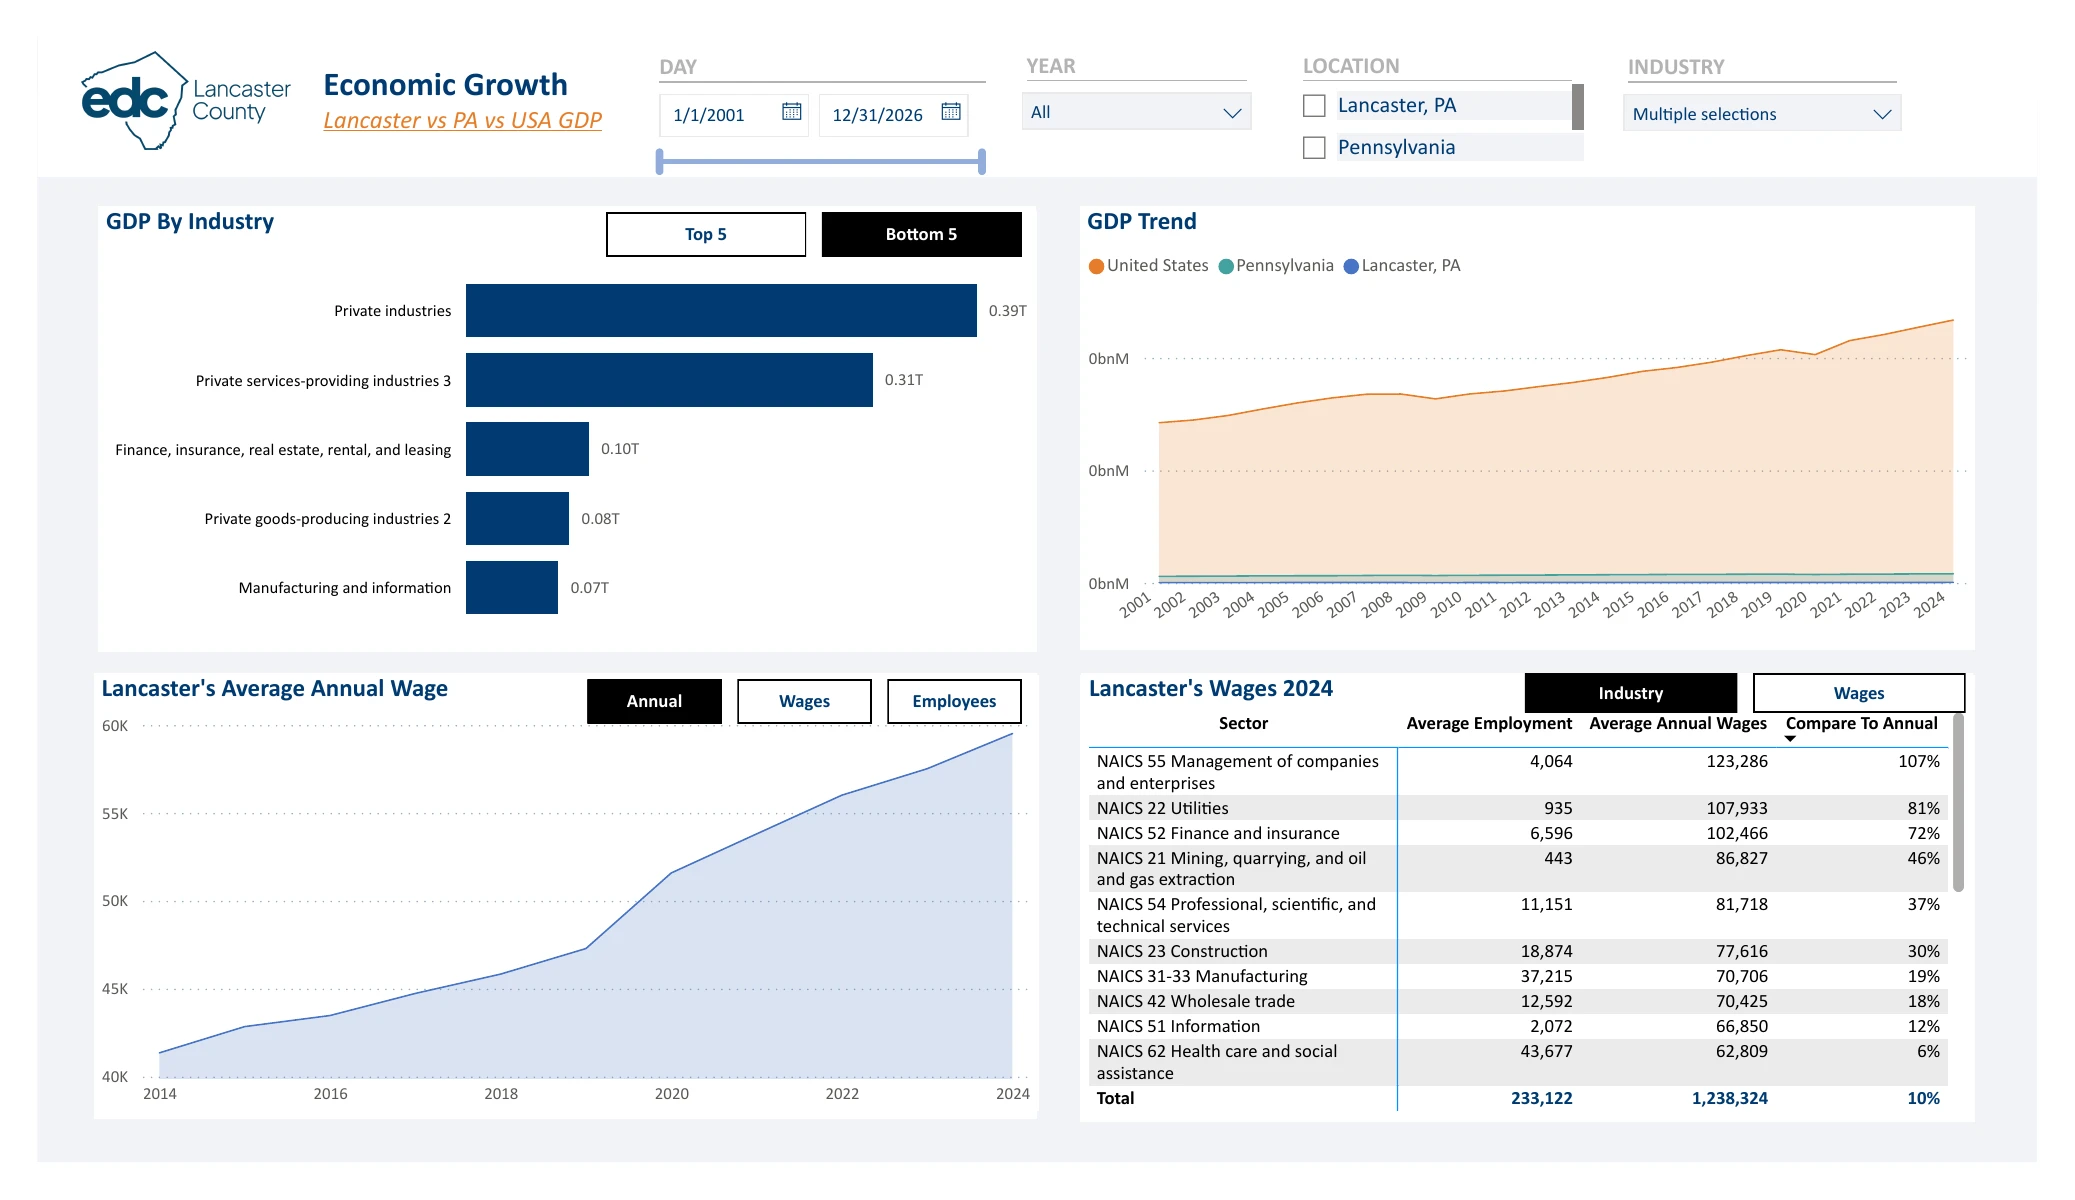
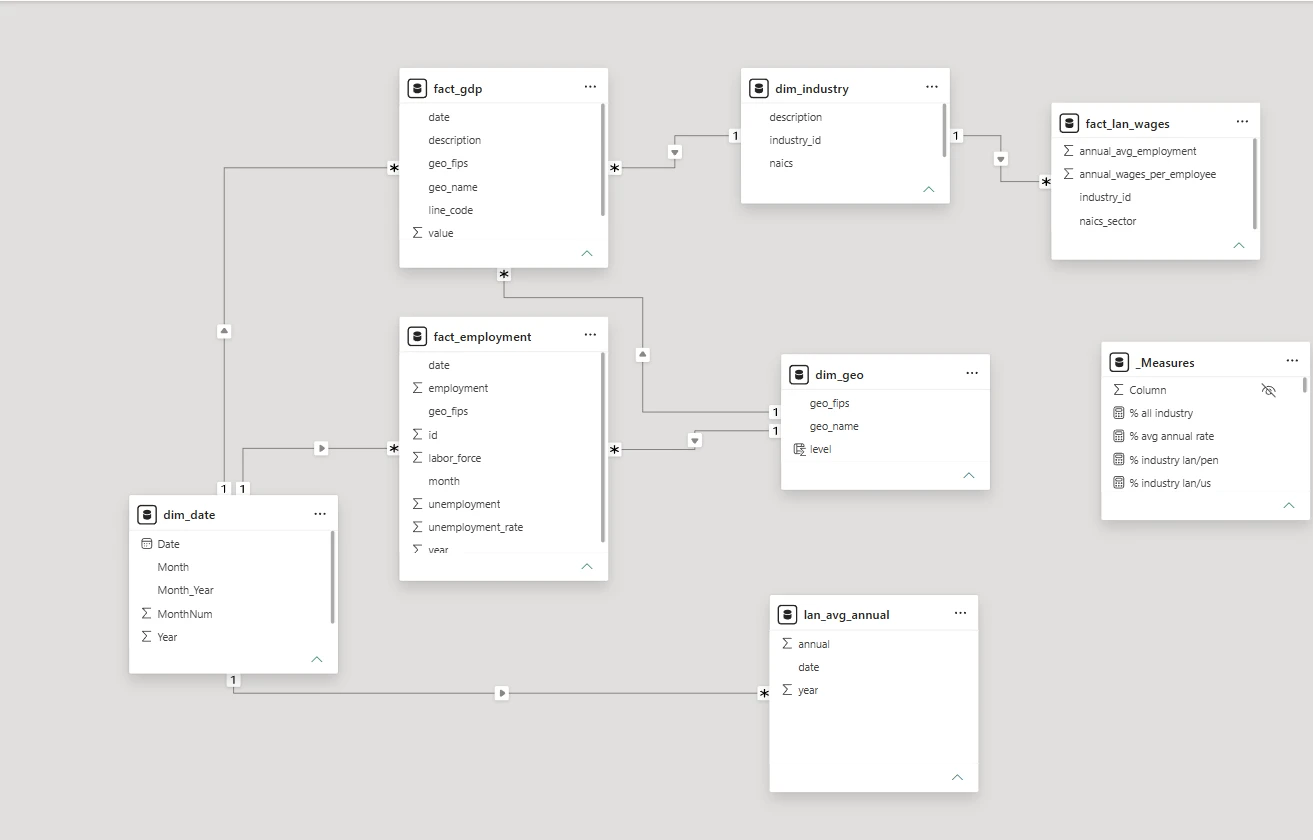
The real report in Power BI Desktop. The subtitles explain each click.
01 // Labor market
02 // Economic growth
What each dashboard and diagram shows, and why it matters. Click an image to enlarge it.
The landing page: KPI cards, annual labor force and unemployment, and monthly trends, with date, year, and location controls.
The same page with the statewide data, for a direct comparison with Lancaster.
Labor-force growth and unemployment rate, Lancaster against Pennsylvania.
Top industries by real GDP, the GDP trend for Lancaster, PA, and the U.S., and Lancaster's wage trend.
The smallest GDP contributors, plus an industry table comparing Lancaster with Pennsylvania and the U.S.
Which industries employ the most people in the county.
Click any image to view it full size.
Ask about my work
Quick answers about my experience and projects
Ask about my experience, projects, or skills.