Skip to content
All projects

Project 05 // Analytics · 2025

RFM Customer Segmentation

Turning every customer segment into a concrete action

Dots representing 18.4 thousand customers sort into segments: 42% At-Risk, 26% Growth, 21% Standard, 10% Premium.
of customers in the largest group (At-Risk)
42%
Customers scored
18.4K
R-F-M codes
64
Named segments (shown as 4 groups)
9

In short

The question

Not every customer is worth the same marketing effort. Which customers are VIPs to reward, and which are at risk of churning and need re-engaging?

What I built

  1. 01
    Sales data18.4K customers
  2. 02
    dim_customer
  3. 03
    DAX R-F-M scoresScored 1 to 4 on recency, frequency and spend
    • DAX calculated columns
  4. 04
    Segment table64 codes mapped to 9 named segments, each with a next action
    • Turning analysis into actions
  5. 05
    Power BI reportRule-based, not a fitted model
    • Power BI

What it found

  • Scored 18.4K customers from 1 to 4 on recency, frequency, and spend, and mapped 64 codes to 9 named segments with a next action each (a rule-based method, not a fitted model); 42% fall in the At-Risk group, the largest to win back.
  • Marketing can see at a glance who to reward, who to win back, and who to leave alone.
  • Power BI
  • DAX
  • Power Query
  • Segmentation

Full case study // tap a section to open it

01Problem & context

Not every customer is worth the same marketing effort. Which customers are VIPs to reward, and which are at risk of churning and need re-engaging?

Marketing budgets are limited. Treating every customer the same wastes money on low-value customers and misses the ones about to churn. RFM segmentation tells a team exactly who to reward, who to win back, and who to leave alone.

Not every customer is worth the same marketing effort. This project segments customers with the classic RFM model (Recency, Frequency, Monetary value) and turns each segment into a concrete action, such as rewarding VIPs or re-engaging customers at risk of churning.

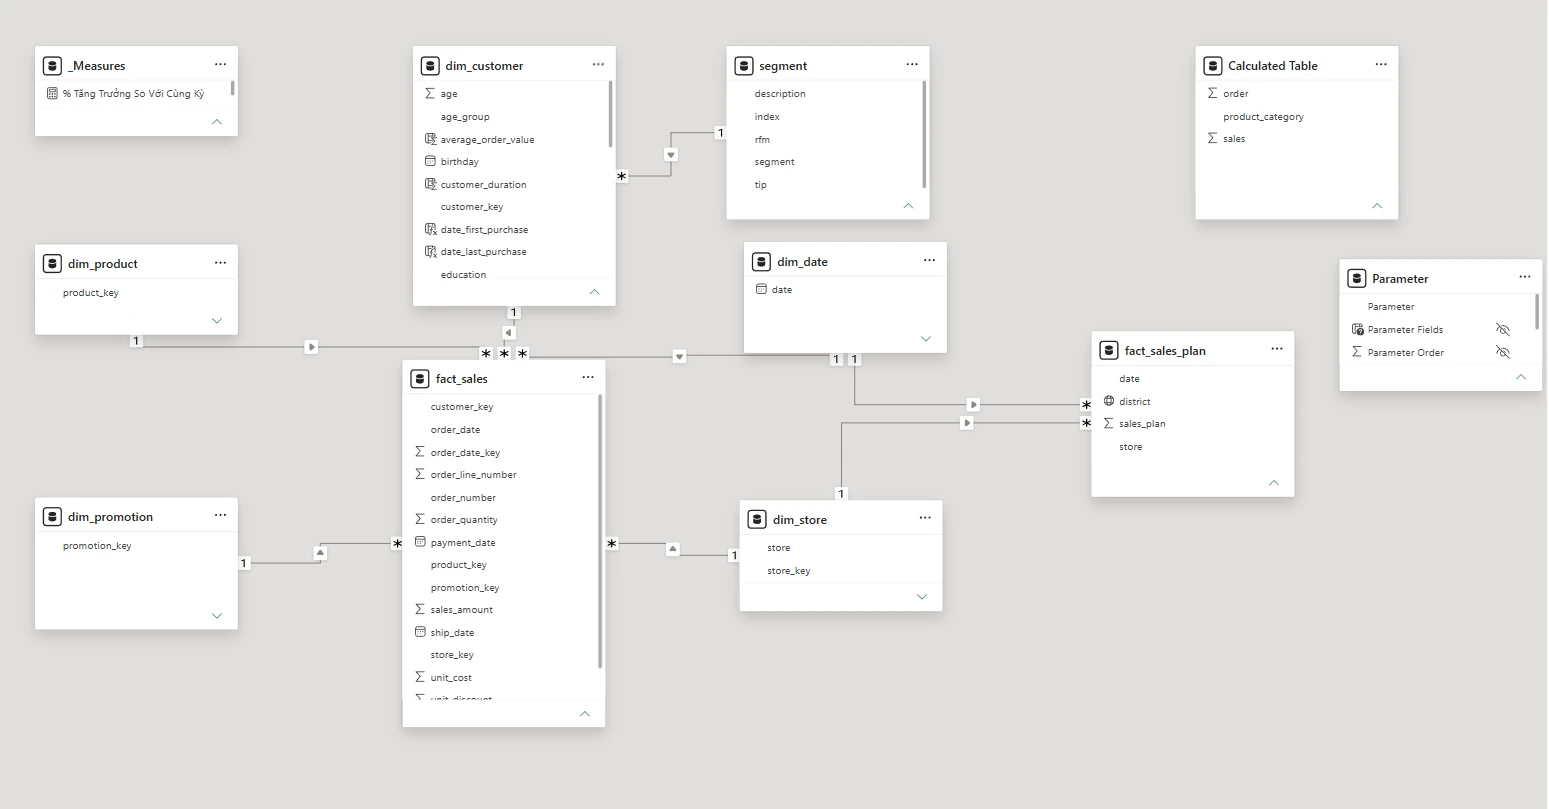
In the Power BI model, DAX calculated columns on dim_customer score recency, frequency, and monetary value from 1 to 4. The resulting R-F-M code (for example 444) links to a segment table, and the report also tracks revenue against the monthly plan.
02My role & approach

Solo project: scoring logic, segment mapping, data model, and report.

  1. 01

    Score: DAX calculated columns on dim_customer score recency, frequency, and monetary value from 1 to 4.

  2. 02

    Segment: the three scores form an R-F-M code (for example 444) that links to a segment table.

  3. 03

    Act: each segment carries a description and a recommended marketing action.

  4. 04

    Track: actual revenue is compared against the monthly revenue plan in the same report.

Problems I hit and how I handled them

  • Scoring lives in the model as DAX calculated columns on dim_customer, so every customer's R, F, and M score updates with the data.
  • 64 possible R-F-M codes map to 9 named segments, each with a description and a recommended marketing action.
  • Segments sit alongside revenue against the monthly plan, so marketing and sales see one picture.
03Tech stack
  • Power BI

    Segment report with recency, frequency, and monetary breakdowns and revenue against plan.

  • DAX calculated columns

    Columns on dim_customer that score each customer 1–4 on recency, frequency, and monetary value and build the R-F-M code.

  • Power Query

    Loading the sales data, the segment table, segment labels, and the monthly revenue plan.

  • Segment table (Excel)

    Maps each R-F-M code to a segment, a description, and a recommended action.

Skills shown

  • Customer analytics
  • DAX calculated columns
  • Power Query
  • Power BI
  • Turning analysis into actions
04What I learned & would improve

Lessons

  • Quartile scores are easy to explain to a marketing team, and the segment names matter as much as the math.
  • Recency has to be measured from one fixed date, or the same customer scores differently each time the report refreshes.

What I would do next

  • Track how customers move between segments month to month.
  • Compare the RFM groups with a clustering method such as k-means to see whether the data suggests different groups.

Explore the report

Rebuilt from the project's data so it opens in any browser, no login. Use the filters and every visual recalculates.

Power BIThanh VuRFM Customer Segmentation
Export .pbixReading view

RFM group

Try a customer score

4 is best: bought most recently, most often, or spent the most.

Average score
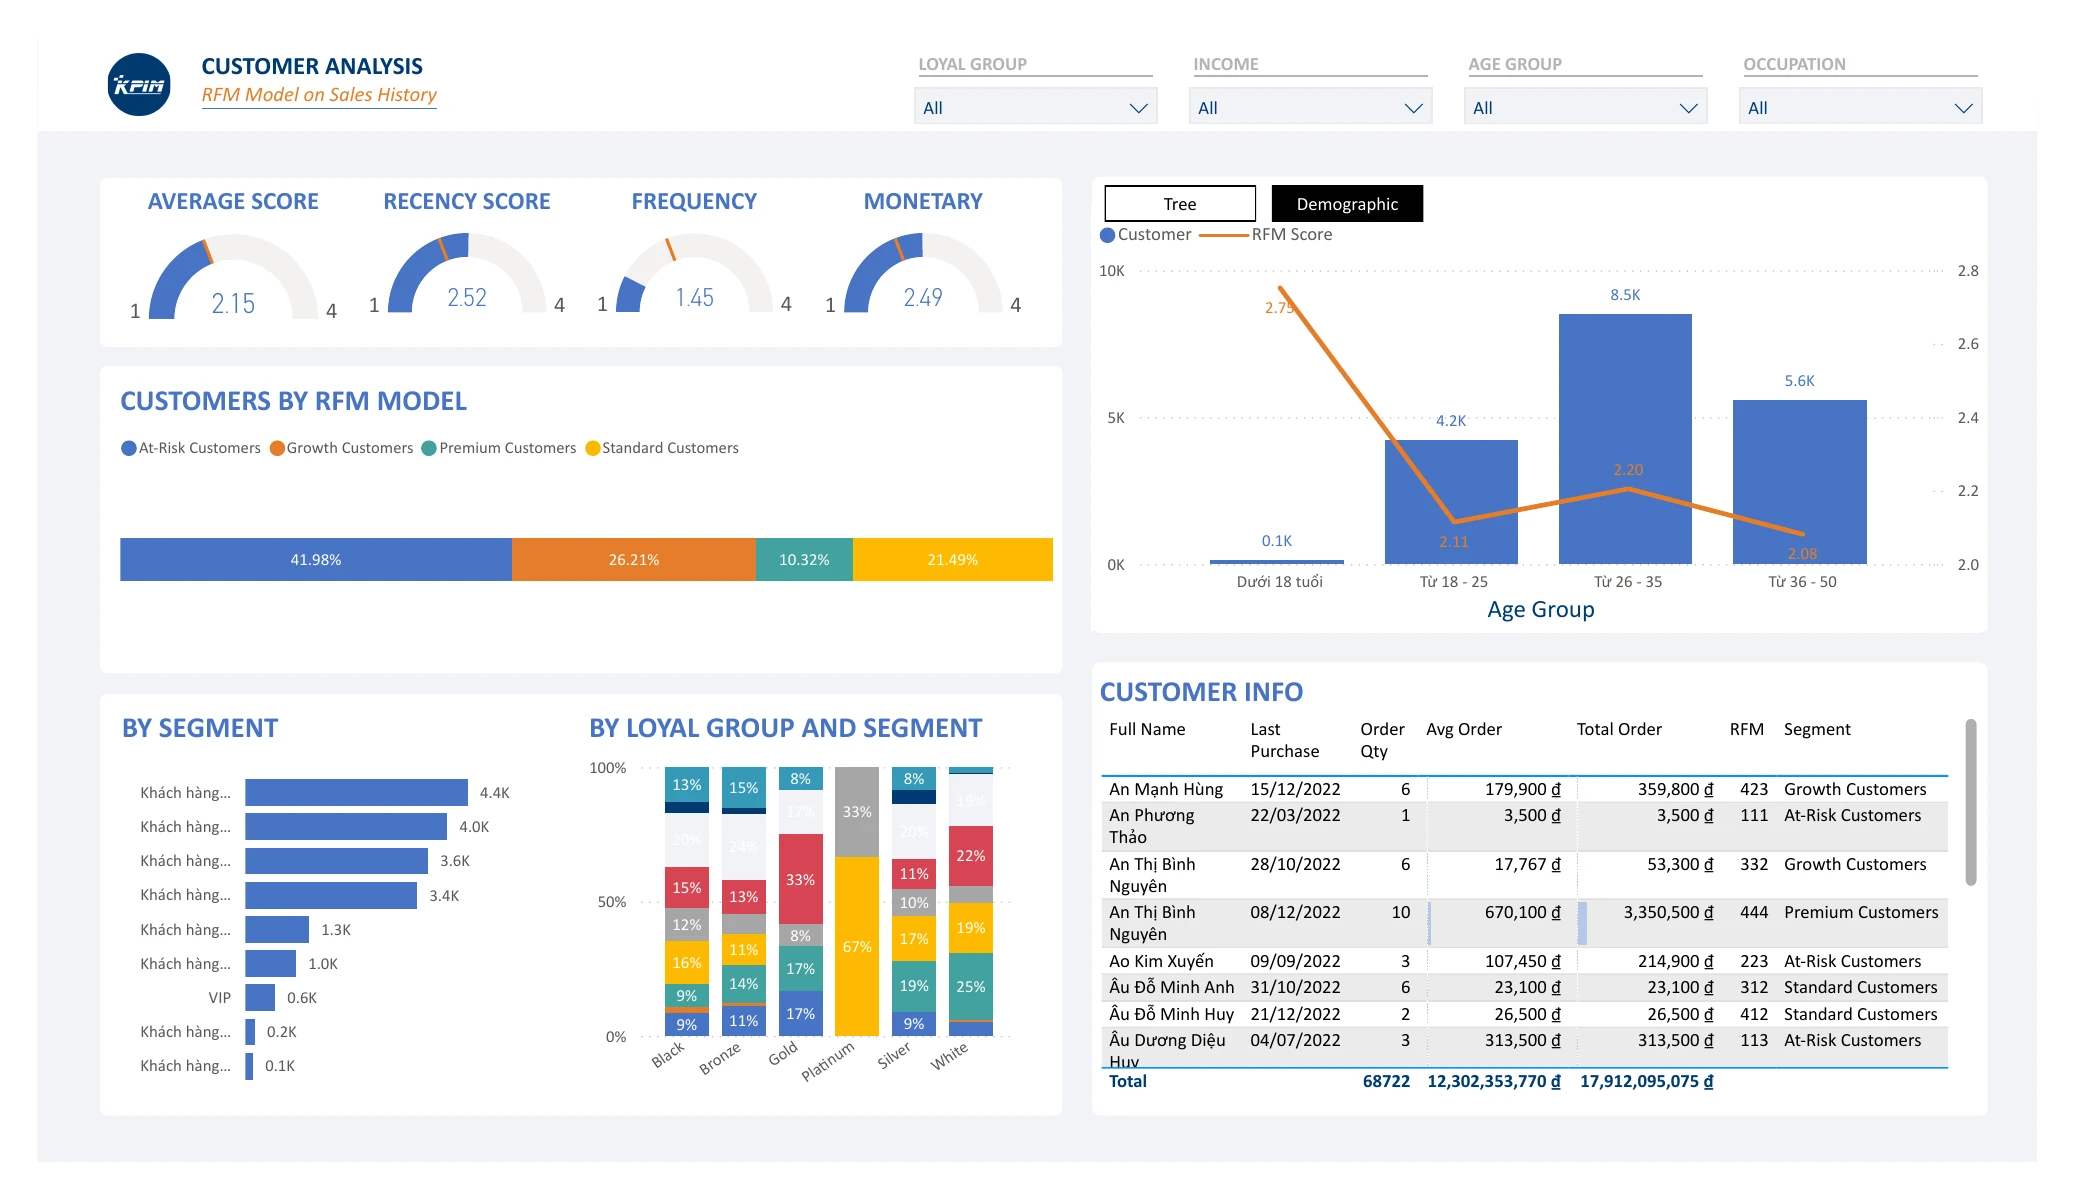
2.1514
Recency
2.5214
Frequency
1.4514
Monetary
2.4914
Customers by RFM group
  • At-risk
  • Growth
  • Premium
  • Standard

Customers and average RFM score by age group

Customers aged 26–35 are the largest group (46% of about 18.4K), but under-18 customers score highest.

Segment for this score

Code 444

VIP

Action:

Values as shown on the Customer Analysis page of the Power BI report (customer counts rounded to the nearest 100, as the report displays them). In the Power BI model, DAX calculated columns on dim_customer score recency, frequency, and monetary value from 1 to 4; the R-F-M code (for example 444) links to the segment table.

Microsoft Power BI1 of 4

See it in Power BI

The real report in Power BI Desktop. The subtitles explain each click.

Power BI Desktop // subtitles on // tap a step to jump

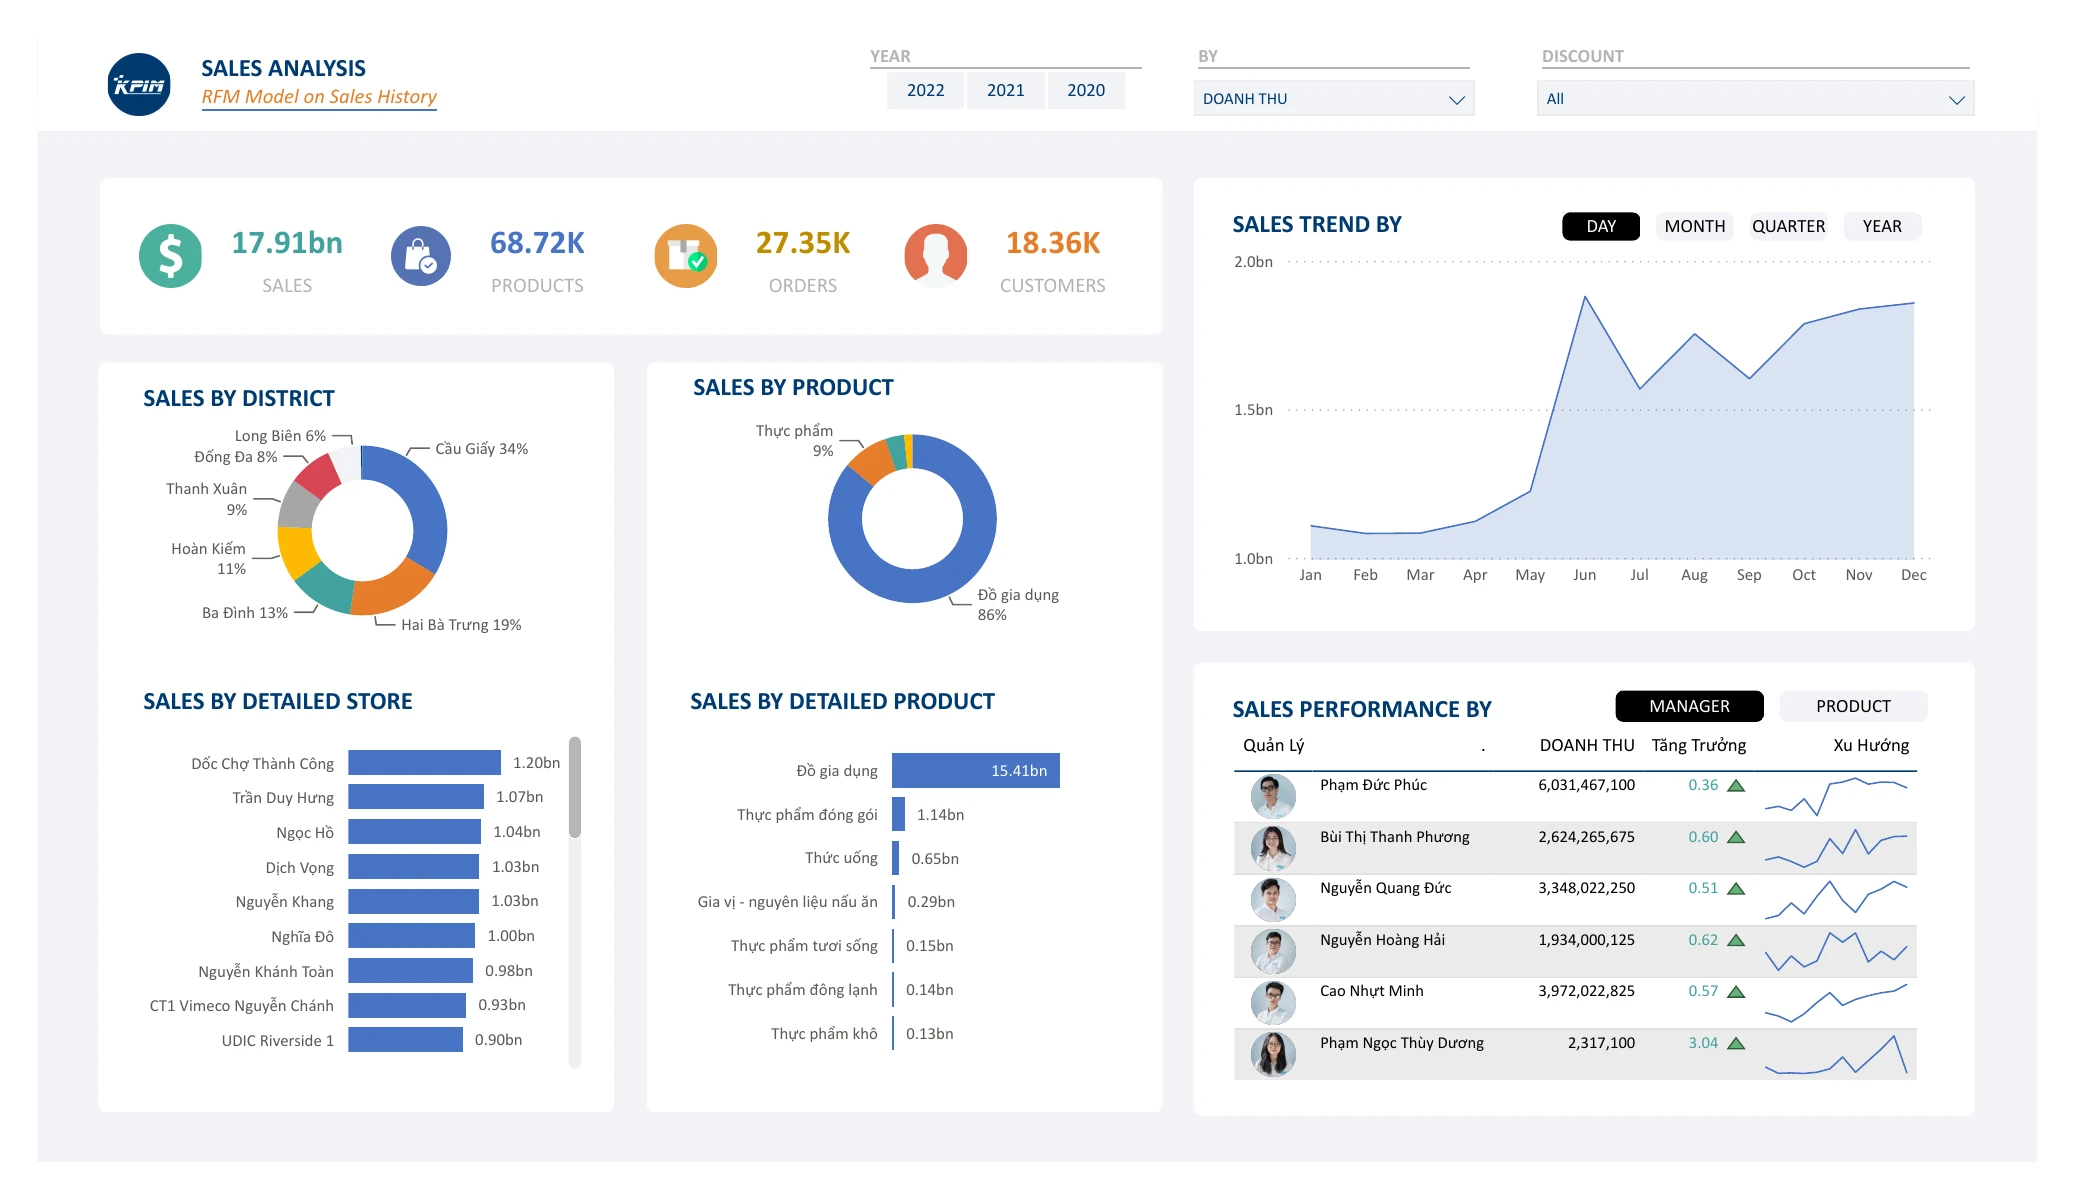
01 // Sales analysis

02 // Customer analysis

Walkthrough

What each dashboard and diagram shows, and why it matters. Click an image to enlarge it.

  1. 1

    Segment playbook

    Every R-F-M combination maps to a named segment with a description and a recommended marketing action.

    • 64 possible score codes (4 × 4 × 4) collapse into 9 segments a marketing team can act on.
    • Each segment says who the customers are and what to do next, so the analysis ends in a decision, not a chart.
  2. 2

    Customer analysis page

    RFM scores, segments, and loyalty groups on one Power BI page.

    • Shows how many customers fall in each segment and how segments relate to loyalty groups.
  3. 3

    Data model

    DAX-scored customers mapped to the segment table, alongside sales and the revenue plan.

    • The R-F-M code calculated on dim_customer is the key that links each customer to its segment.
Next projectBank Transaction SQL Analysis
Esc

↑ ↓ to moveEnter to open